Become our exclusive agent in your region yielding in great revenues Learn More
Reports generated from the POS

How to smartly use your generated business analytics

2022/01/06
By Nadine Hashem

Restaurants and retail software generates data every time an order or a transaction is made through the POS software. 


This data is translated into useful information in clear reports that give you insights about different aspects of your business.


Businesses normally use these reports to analyse their current situation and look for improvements in needed areas. 


Restaurant and retail analytics answer specific questions about your performance. 


  • Why did you fall behind your expectations? 
  • What factors came into play?
  • What does it mean?
  • How to improve the situation?


Analytics equip businesses and especially restaurants with the right tools to actually alter your performance where needed. 


How to use your restaurant analytics?


Which menu item to change?


The reports generated by the menu engineering feature are useful in many ways.


First, the feature clearly indicates your most profitable and most popular menu item. 


It classifies your stars, your puzzles, your plow horses and your dogs. 


Once classified, you can smartly place them in your menu so you promote your puzzles that have low popularity versus high profitability.


In addition to menu engineering, analytics give you indication about items that should be altered depending on their ordered add-ons.


When you review the sales reports and transactions, you can see how waiters are always adding certain items on the plate.


Customers might order extra garlic, extra vinegar, extra pickles or extra cheese. 


They might change the bun of a sandwich or remove a topping.

A report generated from the POS about menu items categories

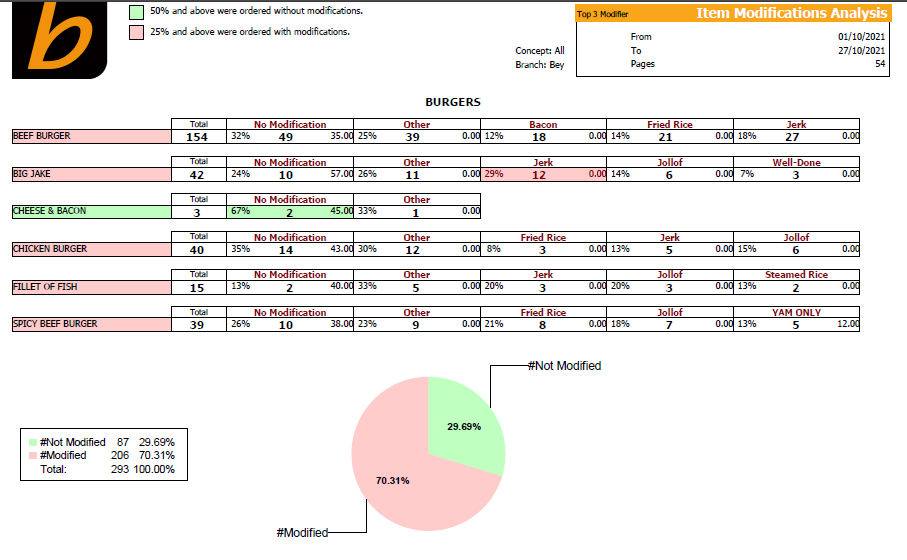
If these requests are frequent, then you should opt to change the item itself. If a wrap is always ordered with a baguette, then it should make you change the sandwich into a baguette one. 


If the majority of the orders ask to replace a certain topping then it’s an indication that you should eventually replace the topping.


These simple yet essential changes enable you to engineer your menu successfully and change your prices accordingly. 


Which location is the most profitable?


Should you drive to your different locations to gain insights about each location’s performance?


Your restaurant analytics should offer you a general idea about different locations' performance leading you to identify the most and the least profitable ones. 


Why is this location falling behind the others? 


Is it the demographics? The location itself? The prices in this specific area?


Do you need to change your hours of operation in certain locations?


Should you schedule more employees to keep up with your busy hours? 


Should you run a virtual restaurant at a specific location instead of having a dine in the area?


These questions are all answered when thoroughly analysing the reports generated.


You might allocate staff differently depending on the busiest locations. 


What’s the busiest day of the month?


Restaurant analytics specify your busiest days.


Is it on weekends? 


Are you considering closing on a certain day such as Mondays?


You might be considering changing your hours of operations and restrict them to the most productive hours.


You need this data for several reasons. First, you need to prepare your staff, schedule more or less people. 


Second, you need to identify the reasons for certain busy days and see what can be done to optimize the profits of these days. 


Third, you need to spot the slowest days and decide your options. Should you attempt to close on certain days or have themed days at your restaurant? 


Taco Tuesdays are an awesome idea to boost your sales on slow Tuesdays. Specials on drinks or appetizers are another way to attract customers. 

All appetizers for $10 on Wednesdays to drive up your midweek sales.


Once an action plan is decided, you can track it to measure its success and study potential alternatives if failed. 


You can easily monitor the changes in sales after the days of specials for a period of time, 3 months for instance.


What’s your top selling category?


When checking your sales figures, you need to go a bit deeper identifying your best selling category.


You might find that the appetizers are best selling items or burgers or maybe entrées.


The pasta varieties might Be your star that skyrocket your sales.


Regardless of the winning category, you need to investigate other categories' improvements. 


Why aren’t your sandwiches selling? 


Why are the soups a failure? 


Why do the salads have low sales?


Should you discontinue the whole category? 


You can try to limit your salad options to reduce the raw material costs. 


You might put them on specials or change the ingredients to appeal to customers.

Report generated from the POS software about different menu items


Maybe the way you promote yourself is affecting the sales of your categories. You might be promoting your restaurant as a fast food restaurant so people are not really encouraged to try out your salads.


Promote your categories in need to improve their numbers because you don’t want to store raw materials that end up as a waste.


What are the Sales forecast?


The Restaurant sector is not an easy sector to predict future performance.


You have your analytics for a reason though. 


When it comes to reports, things don’t just end there. The purpose of these reports is to analyse your situation and performance for improvements.

POS report about revenues from the same period of time different years


Check your monthly sales and average over different months to monitor the average change in sales to have an idea about the coming months.


This helps you scheduling your employees and ordering raw material and supplies accordingly.


Post Tags

Previous Post

BIM POS achievements in year 2021

A challenging year behind us and a bright year ahead!

2021/12/30
As we stepped into the new year, we wanted to reach out to all of you to thank you for an amazing year! It was hard and it was...

Next Post

Employees at a restaurant working and serving guests

Reduce your labor cost percentage with these tips

2022/01/13
Labor issues in restaurant sectors are at the heart of restaurant owners’ concerns. Restaurant owners struggle to find the skilled...

Latest Posts

Mobile QR ordering system

Features and benefits of a mobile QR ordering system

2024/04/18
Convenience is key in all sectors. From online shopping to digital payments, consumers are increasingly turning to technology to...
opening a new restaurant

Steps to opening a new restaurant location

2024/04/04
Opening a new restaurant location is an exhilarating journey filled with excitement and potential. However, it's crucial to approach...